Click on any column title to sort the table by that variable. Deeper method details follow table. Explanation of columns:
| Average (All Images) | Synthetic Errors | Natural Images | Natural Errors | |||||
| Method | OrdAvg | SepAvg | OrdSynth | SepSynth | OrdNat | SepNat | OrdReal | SepReal |
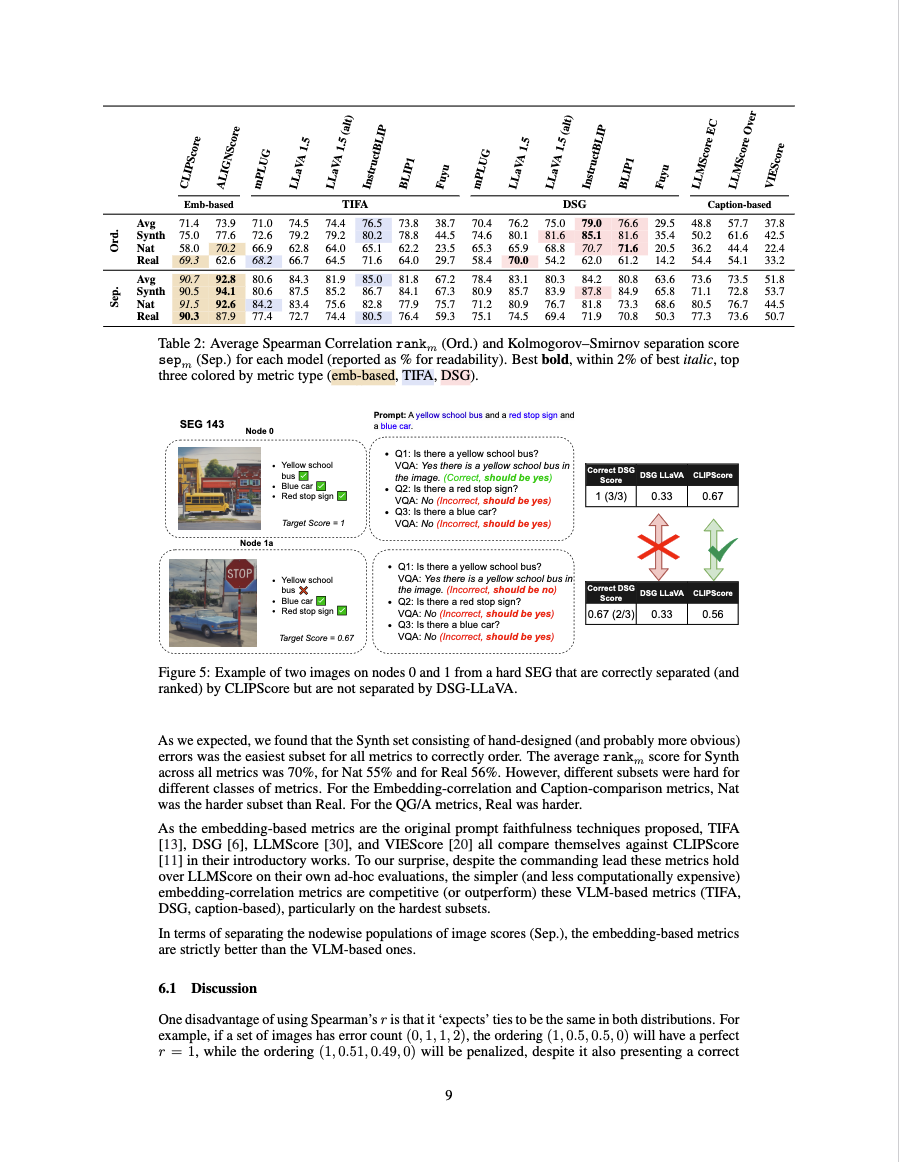
| DSG + InstructBLIP | 0.802 | 0.843 | 0.861 | 0.888 | 0.702 | 0.815 | 0.658 | 0.689 |
| DSG + LLaVA-1.5 | 0.800 | 0.825 | 0.838 | 0.855 | 0.749 | 0.751 | 0.696 | 0.768 |
| DSG + BLIP1 | 0.769 | 0.806 | 0.817 | 0.841 | 0.710 | 0.751 | 0.628 | 0.714 |
| TIFA + InstructBLIP | 0.765 | 0.850 | 0.802 | 0.867 | 0.651 | 0.828 | 0.716 | 0.805 |
| DSG + LLaVA-1.5 (w/prompt eng) | 0.756 | 0.805 | 0.821 | 0.838 | 0.689 | 0.772 | 0.559 | 0.706 |
| TIFA + LLaVA-1.5 | 0.745 | 0.843 | 0.792 | 0.875 | 0.628 | 0.834 | 0.667 | 0.727 |
| TIFA + LLaVA-1.5 (w/prompt eng) | 0.744 | 0.819 | 0.792 | 0.852 | 0.640 | 0.756 | 0.645 | 0.744 |
| ALIGNScore | 0.739 | 0.928 | 0.776 | 0.941 | 0.702 | 0.926 | 0.626 | 0.879 |
| TIFA+ BLIP1 | 0.738 | 0.818 | 0.788 | 0.841 | 0.622 | 0.779 | 0.640 | 0.764 |
| CLIPScore | 0.714 | 0.907 | 0.750 | 0.905 | 0.580 | 0.915 | 0.693 | 0.903 |
| TIFA + MPlug | 0.710 | 0.806 | 0.726 | 0.806 | 0.669 | 0.842 | 0.682 | 0.774 |
| DSG + MPlug | 0.688 | 0.755 | 0.735 | 0.771 | 0.619 | 0.706 | 0.564 | 0.731 |
| LLMScore Over | 0.577 | 0.735 | 0.616 | 0.728 | 0.444 | 0.767 | 0.541 | 0.736 |
| LLMScore EC | 0.488 | 0.736 | 0.502 | 0.711 | 0.362 | 0.805 | 0.544 | 0.773 |
| TIFA + Fuyu | 0.387 | 0.672 | 0.445 | 0.673 | 0.235 | 0.757 | 0.297 | 0.593 |
| VIEScore + LLaVA-1.5 | 0.378 | 0.518 | 0.425 | 0.537 | 0.224 | 0.445 | 0.332 | 0.507 |
| DSG + Fuyu | 0.358 | 0.660 | 0.455 | 0.687 | 0.215 | 0.710 | 0.100 | 0.508 |
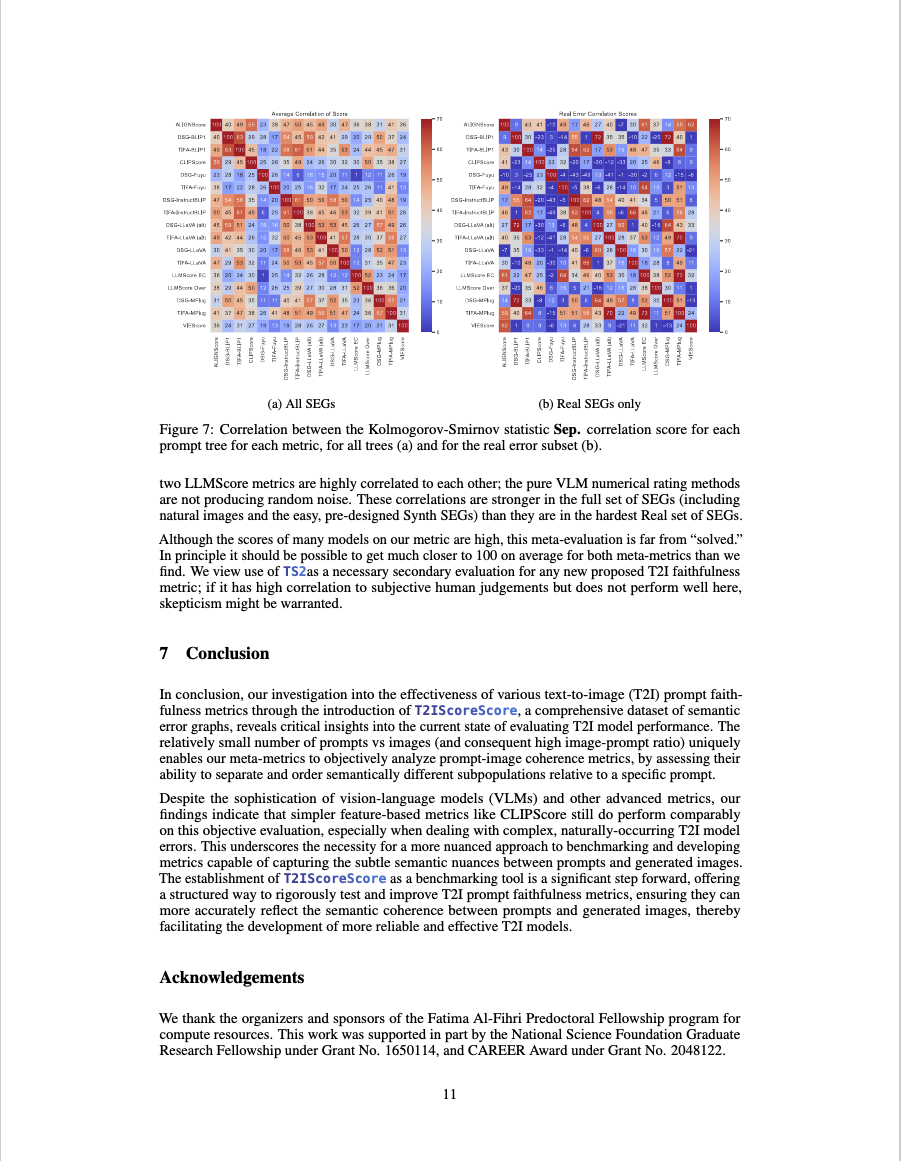
We evaluate the CLIPScore, ALIGNScore, TIFA, DSG, LLMScore, and VIEScore metrics, using a variety of VQA and VLM models where appropriate. On all separation scores, the simplest CLIP and ALIGNScore methods outperform the more complex LLM-based metrics. On the hardest partition for the ordering score, OrdReal, CLIPScore comes within 2% the performance of the best metric.
Images in

As mentioned above,

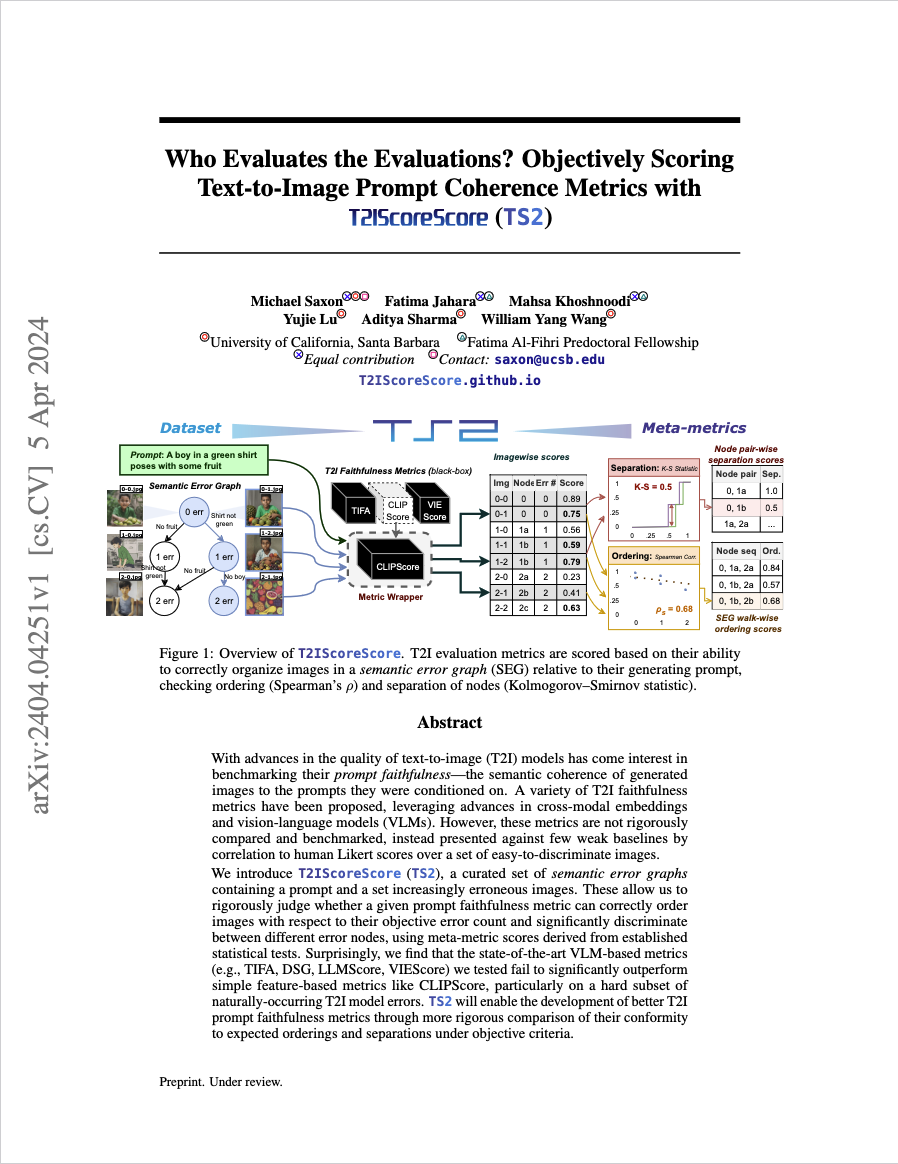
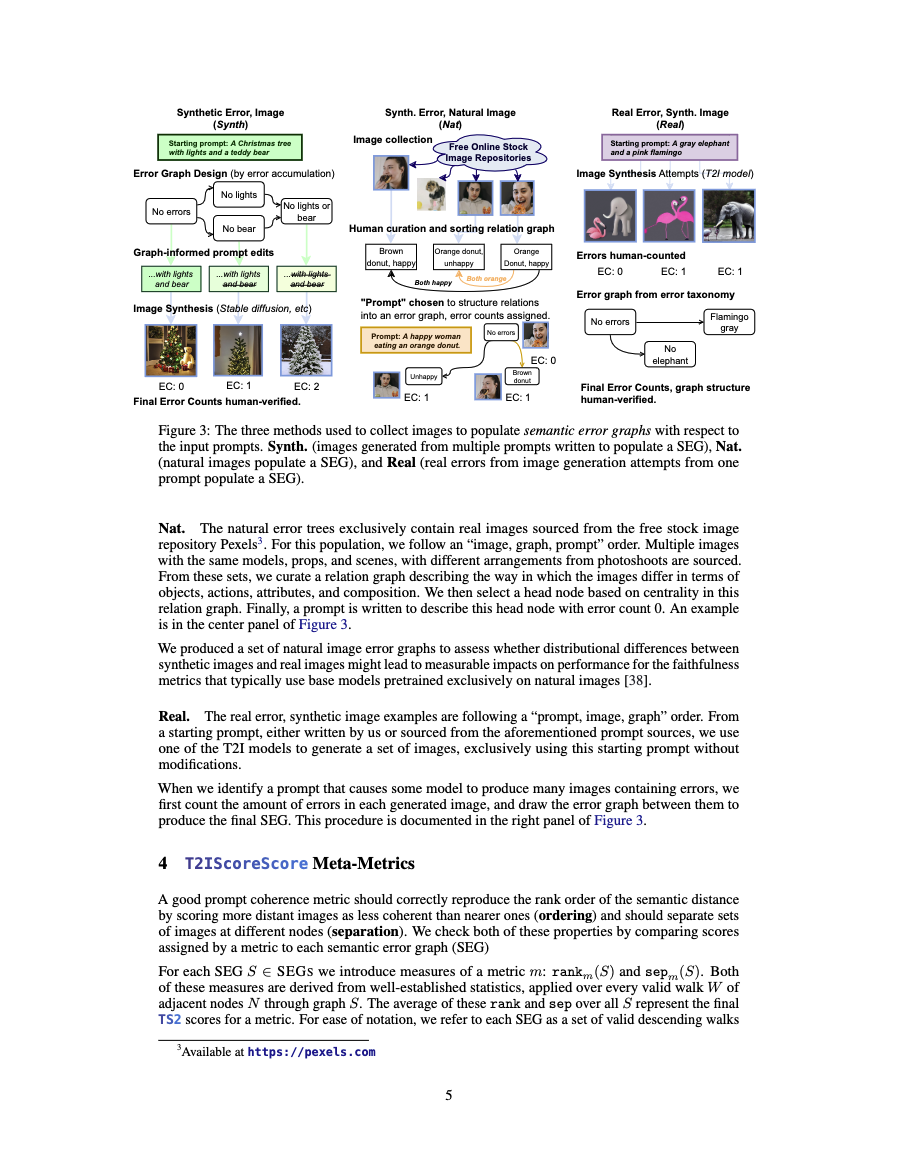
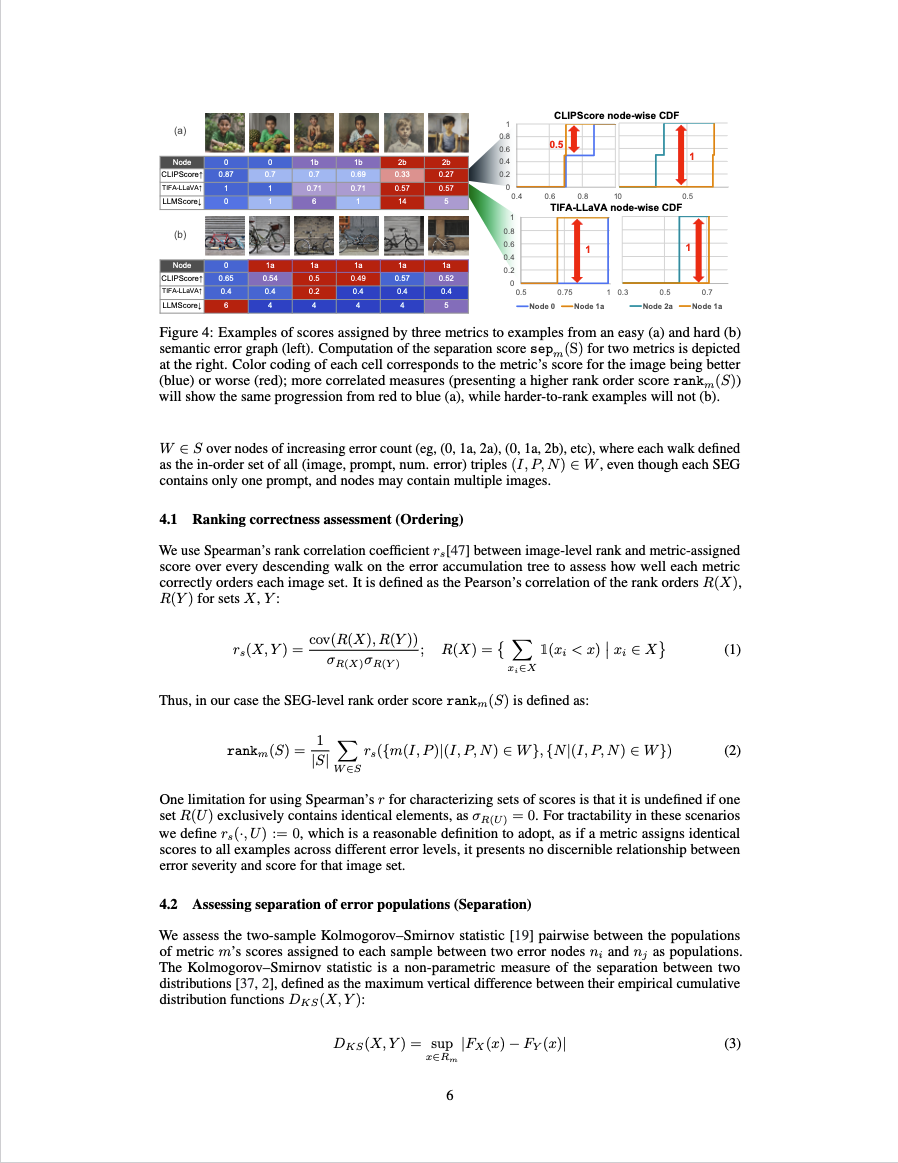
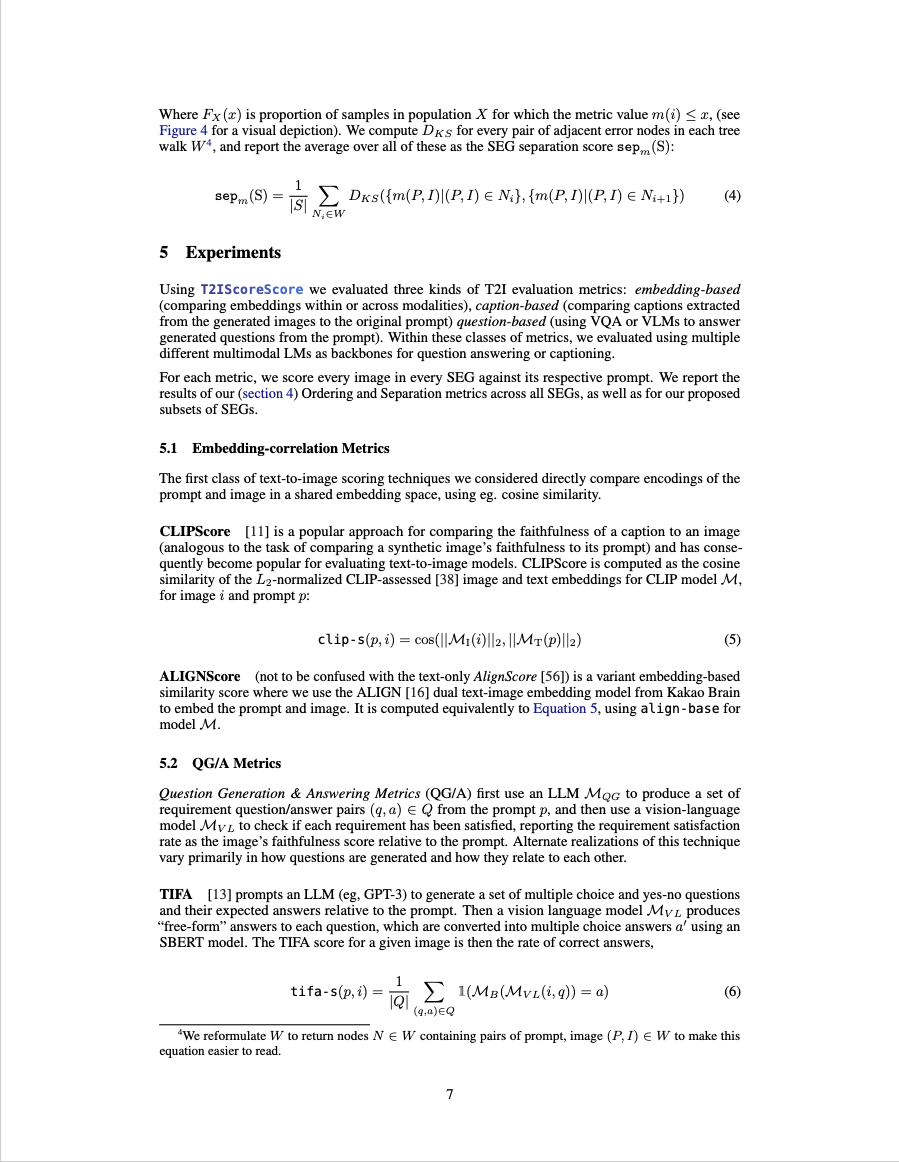
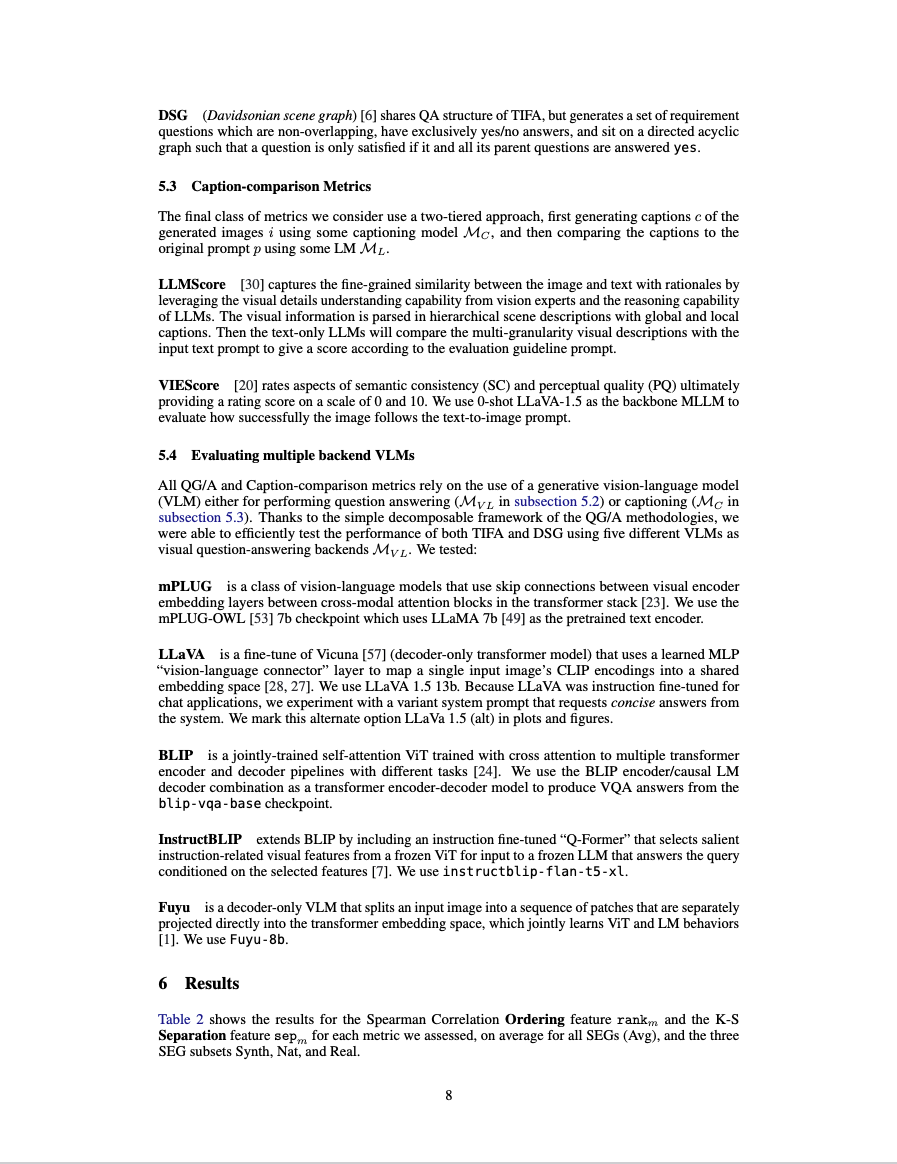
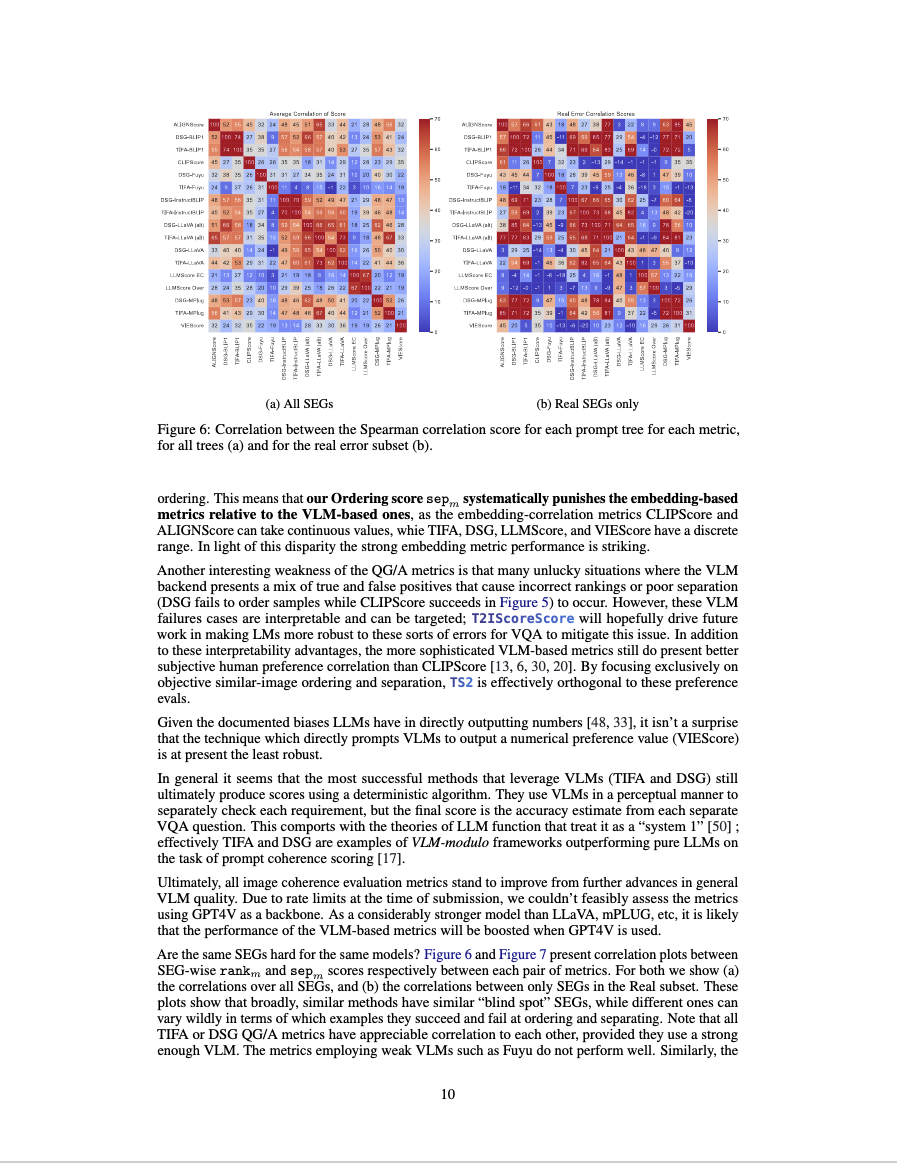
If you really want to know how the meta-metrics work, you should probably read the paper! But basically, they are assessed by having a metric score each image through every walk down each error graph, using Spearman's rank correlation coefficient against expected error count within each walk to assess correctness of ordering, and the two-sample Kolmogorov–Smirnov statistic is assessed between every adjacent pair of nodes in a walk to assess how well a metric separates semantically different populations of images relative to a specific prompt.
The dynamic range of both metrics ranges from 0 to 1 (in the paper we scale this to 100 for readability). Although the scores may look high already, in principle this should be a very easy task. Although the semantic errors we mark are "objective", this objectivity is implictly a human judgement; thus the human performance barrier on this task is near 100%. For a quality T2I faithfulness metric, this effect is really the most important one to capture.
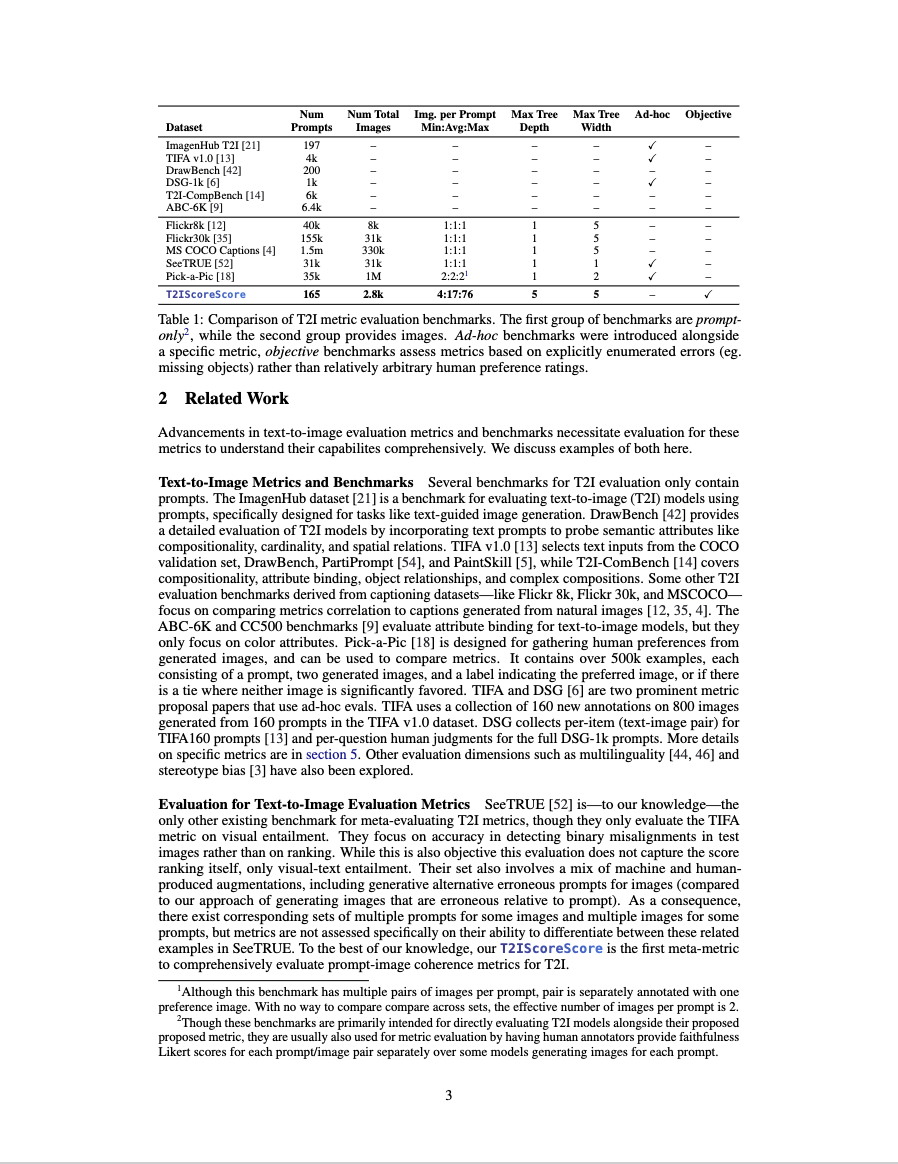
Our work is fundamentally based on evaluating other groups' metrics. SeeTrue is the closest work to our philosophy, with its similar focus on using near-neighbor images to assess T2I models, and investigating mutli-image to single prompt and multi-prompt to single image settings, and also use images. However, they focus more using these examples to build a faithfulness metric that can be used to assess VNLI and VQA tasks directly, rather than using them to evaluate T2I metrics themselves.
The main metrics we analyzed, TIFA and DSG from Yushi Hu and Jaemin Cho are both very influential. We hope that TS2-guided evaluation will enable better metrics inspired from their work.
The captioning based metrics we evaluated, LLMScore and VIEScore both stand to benefit a lot from advancements in VLMs and captioning models.
@misc{saxon2024evaluates,
      title={Who Evaluates the Evaluations? Objectively Scoring Text-to-Image Prompt Coherence Metrics with T2IScoreScore (TS2)},
      author={Michael Saxon and Fatima Jahara and Mahsa Khoshnoodi and Yujie Lu and Aditya Sharma and William Yang Wang},
      year={2024},
      eprint={2404.04251},
      archivePrefix={arXiv},
      primaryClass={cs.CV},
      url={https://arxiv.org/abs/2404.04251}
}